I tested the performance of a simple INSERT in a PL/SQL loop. Unsurprisingly, the block size doesn’t have any measurable impact on the performance, as the total data size remains the same after changing the block size.
However, after turning on block checksums, performance slumps with larger block sizes. This deterioration becomes particulary dramatic when db_block_checking is set to FULL. The graph below shows how the elapsed time changes with the block size and different checksum modes:
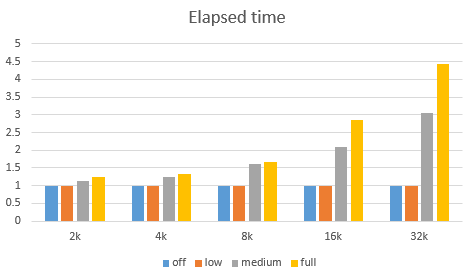
(The elapsed times are normalized by dividing them with the elapsed time of the execution without a checksum.)
We can infer the following from the graph:
- Block size doesn’t have any impact on performance when checksum is turned off.
- LOW checksum doesn’t have any impact either.
- The overhead skyrockets for larger blocks with MEDIUM and FULL checksums.
The last observation is counterintuitive and, as such, worth a more detailed consideration. I mean it’s expected that the checksum calculation for a single block is proportional to the block size. However, since the total amount of data doesn’t change, the elapsed time should stay the same, right?
Let’s see why that’s not the case.
Since the whole elapsed time is spent on CPU I started the analysis with stack profiling:
dtrace -x ustackframes=100 -n 'profile-97 /pid == 26348/ { @[ustack()] = count(); } tick-60s { exit(0); }' The most executed stack with 32k block size, expectedly, contains some block checking functions:
libc.so.1`qsort+0x575
oracle`kd4_entries_overlap+0x42
oracle`kdb4chk1+0xecd
oracle`kd4chk+0x79
oracle`kdgchk+0x2ac
oracle`kcbchk_ctx+0xe1
oracle`kco_blkchk+0x9a
oracle`kcoapl+0x825
oracle`kcbapl+0x147
oracle`kcrfw_redo_gen_ext+0x1054
oracle`kcbchg1_main+0x1bca
oracle`kcbchg1+0xe3
oracle`ktuchg2+0x903
oracle`ktbchg2+0x118
oracle`kdtchg+0x453
oracle`kdtwrp+0xa46
oracle`kdtSimpleInsRow+0x1b3
oracle`qerltcSimpleSingleInsRowCBK+0x3a
oracle`qerltcSingleRowLoad+0x13f
oracle`qerltcFetch+0x1ca
oracle`insexe+0x33e
...
But the topmost function is the generic C function qsort, which sorts an array. We can infer the cause of the performance decrease by analyzing its behavior. That isn’t difficult, since the function is well known and documented. It’s worth noting that the array size is passed as the second argument:
void qsort(void *base, size_t nel, size_t width,
   int (*compar)(const void *, const void *));
Obviously, the execution duration depends on the array size, that is, the number of elements to sort.
I wrote the following DTrace script to capture some qsort execution statistics:
pid$target::qsort:entry
{
  self->start_time = timestamp;
  @elements_count["sorted elements total"]=sum(arg1);
  @elements_histogram["sorted elements"]=quantize(arg1);
}

pid$target::qsort:return
/ self->start_time /
{
  this->elapsed=timestamp - self->start_time;
  @time["elapsed (ns)"]=sum(this->elapsed);
  @time_histogram=quantize(this->elapsed);
  @count["#calls"]=count();
  self->start_Time = 0;
}
In particular, the script collects the following information:
- number of elements sorted – total and histogram (“sorted elements”)
- elapsed time – total and histogram (“elapsed”)
- total number of qsort calls (“#calls”)
Let’s compare the statistics for 2k, 8k and 32k executions:
2k:
sorted elements total                                       8000225
sorted elements
   value  ------------- Distribution ------------- count
       1 |                                         0
       2 |@                                        1274
       4 |@                                        2548
       8 |@@                                       5096
      16 |@@@@                                     10192
      32 |@@@@@@@@                                 20375
      64 |@@@@@@@@@@@@@@@@                         40768
     128 |@@@@@@@@                                 19747
     256 |                                         0

elapsed [ns]                                              699793753

   value  ------------- Distribution ------------- count
    1024 |                                         0
    2048 |                                         1119
    4096 |@@@@@@@@@@@@@@@@@@@@@@@@@@@@@@@@@@@      86631
    8192 |@@@@                                     10289
   16384 |@                                        1733
   32768 |                                         199
   65536 |                                         23
  131072 |                                         4
  262144 |                                         2
  524288 |                                         0

#calls                                                       100000
8k:
sorted elements total                                      33179680
sorted elements
   value  ------------- Distribution ------------- count
       1 |                                         0
       2 |                                         304
       4 |                                         608
       8 |                                         1216
      16 |@                                        2432
      32 |@@                                       4864
      64 |@@@@                                     9682
     128 |@@@@@@@@                                 19329
     256 |@@@@@@@@@@@@@@@@                         38766
     512 |@@@@@@@@@                                22801
    1024 |                                         0

elapsed [ns]                                             1563842848

   value  ------------- Distribution ------------- count
    1024 |                                         0
    2048 |                                         393
    4096 |@@@@@@@@@                                21604
    8192 |@@@@@@@@@@@@@                            32092
   16384 |@@@@@@@@@@@@@@@@@@                       44842
   32768 |                                         538
   65536 |                                         297
  131072 |                                         235
  262144 |                                         1
  524288 |                                         0

#calls                                                       100002
32k:
sorted elements total                                     134287264
sorted elements
   value  ------------- Distribution ------------- count
       1 |                                         0
       2 |                                         74
       4 |                                         148
       8 |                                         296
      16 |                                         592
      32 |                                         1184
      64 |@                                        2368
     128 |@@                                       4738
     256 |@@@@                                     9472
     512 |@@@@@@@@                                 18944
    1024 |@@@@@@@@@@@@@@@                          38687
    2048 |@@@@@@@@@                                23500
    4096 |                                         0

elapsed [ns]                                             6116756180

   value  ------------- Distribution ------------- count
    1024 |                                         0
    2048 |                                         23
    4096 |@@                                       5202
    8192 |@@@                                      7717
    6384 |@@@@@@                                   14295
   32768 |@@@@@@@@@@@                              27297
   65536 |@@@@@@@@@@@@@@@@@@                       44033
  131072 |                                         734
  262144 |                                         356
  524288 |                                         346
 1048576 |                                         0

#calls                                                       100003
Thanks to the histograms we can clearly see, that the number of sorted elements is proportional to the block size. Consequently, elapsed time per qsort execution increases too. The key point is that the number of executions doesn’t depend on the block size, because the checksum seems to be computed for every insert.
In other words, the overhead increases, because calculating the checksum for a larger block requires more work, and, at the same time, the number of checksum calculations remains the same after increasing the block size.
In conclusion, the DML performance sucks with large blocks and checksums turned on.
One question that I’d like to pursue is “how many rows per block”. Is the sort sizer an indication of the number of rows, and does that mean your row consisted of just a single column holding (e.g.) a sequence number?
If this is the case then the observation seems important for indexes with small key values that might jump from (e.g.) 250 entries per leaf block to 1,000 entries per leaf block as you moved from 8KB to 32KB, but the impact on tables which might go from 40 rows to 160 rows on the same change.
Originally, I tested with a simple table containing just one integer column and without any indexes. The average sort size (qsort input) was roughly “rows per block”/12, irrespective of the block size.
Now I did the second set of tests with and without an index:
i_full_t_32k.log:Elapsed: 00:00:31.69
i_full_t_8k.log:Elapsed: 00:00:17.23
i_medium_t_32k.log:Elapsed: 00:00:10.48
i_medium_t_8k.log:Elapsed: 00:00:09.99
i_low_t_32k.log:Elapsed: 00:00:05.97
i_low_t_8k.log:Elapsed: 00:00:10.61
i_off_t_32k.log:Elapsed: 00:00:08.79
i_off_t_8k.log:Elapsed: 00:00:07.52
noi_full_t_32k.log:Elapsed: 00:00:18.19
noi_full_t_8k.log:Elapsed: 00:00:09.32
noi_medium_t_32k.log:Elapsed: 00:00:05.39
noi_medium_t_8k.log:Elapsed: 00:00:05.80
noi_low_t_32k.log:Elapsed: 00:00:04.41
noi_low_t_8k.log:Elapsed: 00:00:04.51
noi_off_t_32k.log:Elapsed: 00:00:04.30
noi_off_t_8k.log:Elapsed: 00:00:04.30
(The prefix “i” is for the tests with index, “noi” without.)
I suggest the following arithmetic to predict the index overhead with the enabled checksum.
Let dt be the table-only overhead ( i.e. without index):
dt = noi_full – noi_off
Let di be the predicted index-only overhead:
di = dt * leaf_blocks/blocks = ( noi_full – noi_off ) * leaf_blocks/blocks
The measured overhead of the index table i_full – i_off is:
i_full – i_off = dt + di = ( noi_full – noi_off ) + ( noi_full – noi_off ) * leaf_blocks/blocks = ( noi_full – noi_off ) * (1 + leaf_blocks/blocks)
For our case:
SQL> select table_name,leaf_blocks from dba_indexes where table_name in (‘T_8K’,’T_32K’);
TABLE_NAME LEAF_BLOCKS
——————————————————————————————————————————– ———–
T_32K 49
T_8K 199
SQL> select table_name,blocks from dba_tables where table_name in (‘T_8K’,’T_32K’);
TABLE_NAME BLOCKS
——————————————————————————————————————————– ———-
T_8K 244
T_32K 60
Verification for 8k:
i_full – i_off = 17.23 – 7.52 = 9.71
( noi_full – noi_off ) * (1 + leaf_blocks/blocks) = ( 9.32 – 4.30 ) * ( 1 + 199/244) = 9.11
Verification for 32k:
i_full – i_off = 31.69 – 8.79 = 22.9
( noi_full – noi_off ) * (1 + leaf_blocks/blocks) = ( 18.19 – 4.30 ) * ( 1 + 49/60 ) = 25.23
The predicted values are within the measurement error.