There are n! possible ways to order n tables in a join. Of course, the optimizer won’t cost all of the permutations to find the best plan. It will rather limit its search space in order to produce a good enough plan within a reasonable amount of time.
The considered permutations are tracked in the CBO trace, like for example:
...
Join order[3]:  T1[T1]#0  T2[T2]#1  T3[T3]#2  T4[T4]#3  T5[T5]#4  T6[T6]#5  T7[T7]#6  T8[T8]#8  T8[T8]#7  T10[T10]#9
...
Generally, the tables with lower cardinality tend to be joined first (“Considering cardinality-based initial join order.”)
I’d like to share the Python script for aggregating and visualizing the number of times a table was considered on each position in the join. Notice that the scripts relies on some non-default Python modules: pandas, seaborn and numpy.
I wrote it, at first, for experimental purposes. But then it turned out to be useful for explaining why sometimes a plan with a lower cost wasn’t chosen. In such case, you can generate the heatmap and check whether the leading tables from the better plan were even considered as leading tables in the suboptimal plan. By the way, that’s exactly what can happen with some query transformations.
To demonstrate the usage, I’ll create 10 tables – t1 having the lowest cardinality and t10 the highest.
declare
  i integer ;
begin
  for i in 1..10
  loop
    execute immediate
      'create table t' || i ||
      ' as select level n from dual connect by level <= ' || power( 4, i)
  ;
  end loop ;
end ;
/
Then I’ll generate the CBO trace for the cartesian join of these 10 tables:
alter session set tracefile_identifier = 'JOIN_ORDER' ;

ALTER SESSION SET EVENTS='10053 trace name context forever, level 1' ;

explain plan for select t10.* from t1,t2,t3,t4,t5,t6,t7,t8,t8,t10 ;

ALTER SESSION SET EVENTS '10053 trace name context off';
The simplest way to produce the heatmap is as follows:
python join_permutations_heatmaps.py CBO_trace_file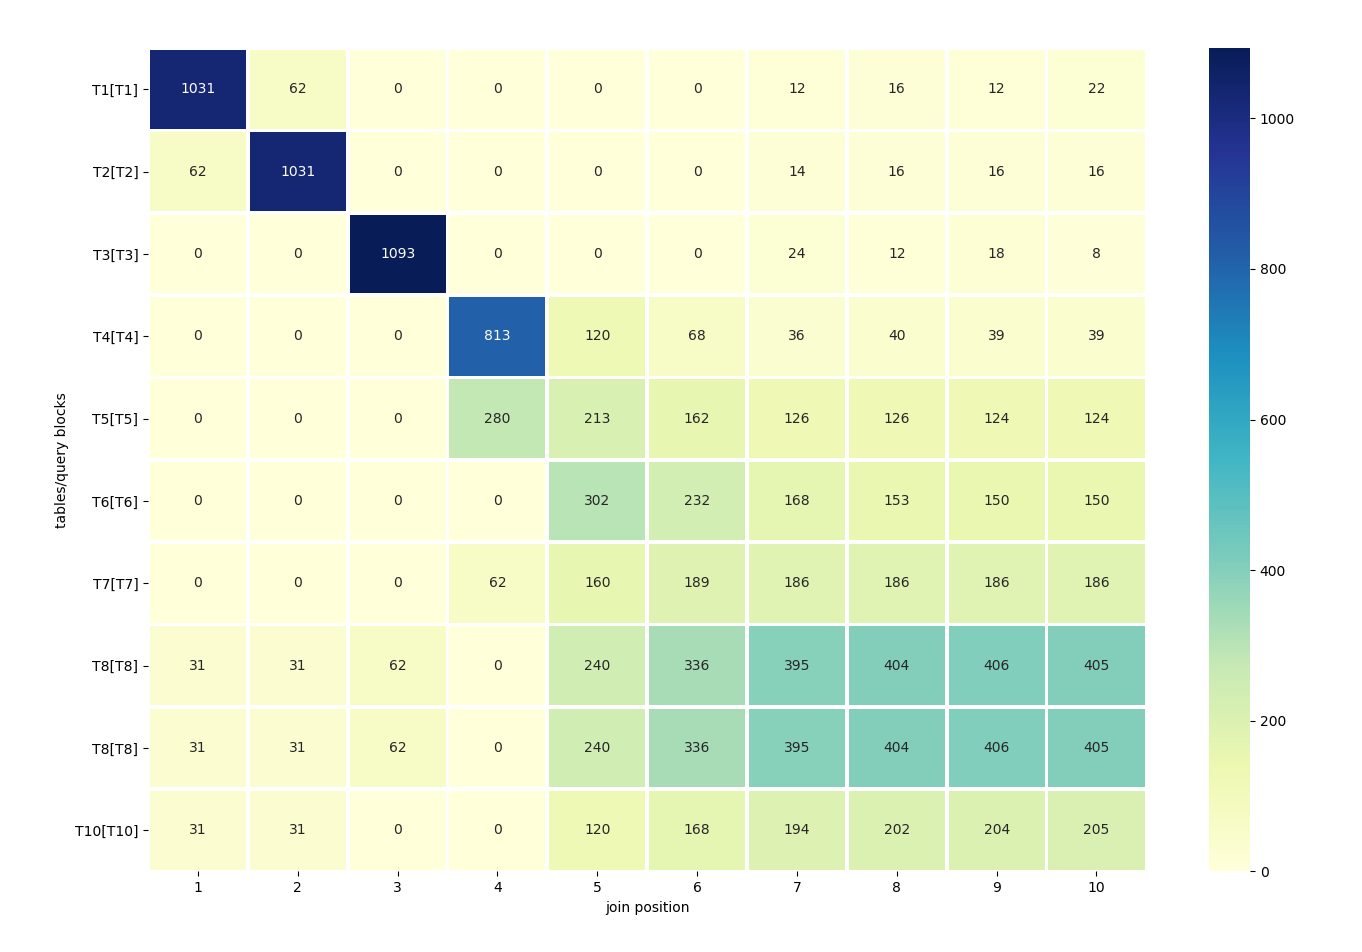
By the way, in the graph above, we can clearly see that the tables with fewer rows are the ones mainly considered for the leading positions.
If you’re an “ASCII type of person” you can specify the –text parameter to get the output in the text format:
python join_permutations_heatmaps.py --text CBO_trace_file

            1     2     3    4    5    6    7    8    9    10
T1[T1]    1031    62     0    0    0    0   12   16   12   22
T2[T2]      62  1031     0    0    0    0   14   16   16   16
T3[T3]       0     0  1093    0    0    0   24   12   18    8
T4[T4]       0     0     0  813  120   68   36   40   39   39
T5[T5]       0     0     0  280  213  162  126  126  124  124
T6[T6]       0     0     0    0  302  232  168  153  150  150
T7[T7]       0     0     0   62  160  189  186  186  186  186
T8[T8]      31    31    62    0  240  336  395  404  406  405
T8[T8]      31    31    62    0  240  336  395  404  406  405
T10[T10]    31    31     0    0  120  168  194  202  204  205
Last but not least, complex queries may contain many query blocks, each of which is costed separately. By default, the heatmaps will be generated for all of them. However, you can limit the scope by specifiying a query block to focus on: –qb QB.
This looks cool!
Interesting / strange that the bigger tables were considered for the first position join T8[T8] and T10[T10] while 3-7 weren’t (is it a typo that T8[T8] is there twice ?).
Kyle
Thank you, Kyle, for your feedback.
Well spotted – T8 appears twice in the heatmap, because I inadvertently referenced it twice (and omitted T9) in the query:
explain plan for select t10.* from t1,t2,t3,t4,t5,t6,t7,t8,t8,t10 ;Unlike T10, T3 indeed never appeared in the first position. A possible explanation could be that there’s a heuristic rule to allocate a relatively small number of permutations where the biggest tables are being pushed away from the tail toward the first positions. A rationale – I’m just speculating – might be to examine the search subspace in which is, generally, less probable, though not impossible, to find an optimal plan.