Measuring performance
I measured the number of loop iterations per ms in TSQL (SQL server 2017) and PL/SQL (Oracle 18 XE) on a Windows server. Besides that, I compared them with the C implementation, just to get an idea of the overhead when executing a simple loop in a database.
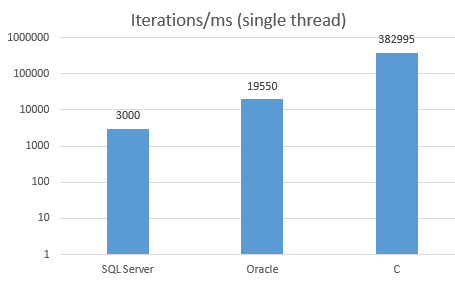
Notice that the Y-axis scale is logarithmic, so the differences are much larger than they visually appear.
We can see that Oracle outperforms SQL Server by an order of magnitude.
Next, I’ll be focusing on how the execution time changes with a concurrent load.
Scalability
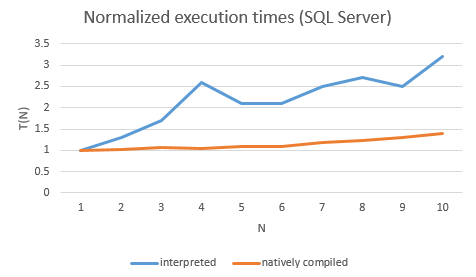
Since I don’t have multi-core licences for Oracle on Windows, I measured the execution times on Solaris x64. In order to compare the databases on different platforms, I normalized the mean execution time by dividing it with the execution time of a single session test:
(1) 
In other words, T(N) is a factor by which the performance degrades when N sessions are running simultaneously.
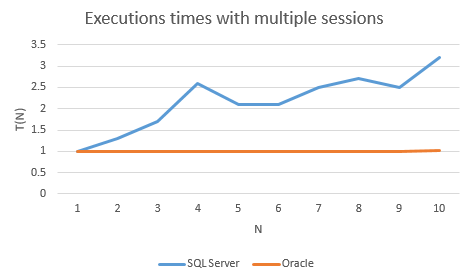
Unlike Oracle, SQL Server doesn’t scale at all – the execution time dramatically increases with the load. For example, the execution time is twice as long when 5 sessions are executing the load.
In conclusion, not only does SQL Server perform much worse than Oracle, but also it doesn’t scale.
As the procedure is completely CPU-bound, stack profiling will provide a clue to where the time goes.
Stack profiling
I used Windows Performance Toolkit for collecting and aggregating stacks and also Bruce Dawson’s awesome UIforETW for facilitating the whole process.
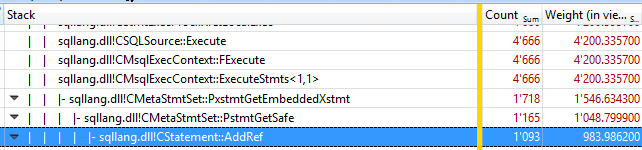
As you can see, the stack part beginning with the function CMetaStmtSet::PxstmtGetEmbeddedXstmt consumed more than 30% of the total execution time. So, it makes sense to inspect the lowest function on the stack: sqllang!CStatement::AddRef.
Serialization
By observing its input and output with WINDBG, we can see that the function increments the memory location passed through the RCX register. Actually, the exact memory location is RCX+7C0h.
The calls to sqllang!CStatement::AddRef are traced with WINDBG – the following commands spool the thread information and the RCX register value:
bp sqllang!CStatement::AddRef "~.; r rcx; gc"Here’s the excerpt from the rather long output:
...
.  6  Id: 1bac.1ff4 Suspend: 1 Teb: 000000aa`cb8f2000 Unfrozen
      Start: sqldk!SchedulerManager::ThreadEntryPoint (00007ffc`1eda7c10)
      Priority: 0  Priority class: 32  Affinity: 3e0
rcx=000001fad58e93b0
.137  Id: 1bac.1b54 Suspend: 1 Teb: 000000aa`cb906000 Unfrozen
      Start: sqldk!SchedulerManager::ThreadEntryPoint (00007ffc`1eda7c10)
      Priority: 0  Priority class: 32  Affinity: 1f
rcx=000001fad58e93b0
.  6  Id: 1bac.1ff4 Suspend: 1 Teb: 000000aa`cb8f2000 Unfrozen
      Start: sqldk!SchedulerManager::ThreadEntryPoint (00007ffc`1eda7c10)
      Priority: 0  Priority class: 32  Affinity: 3e0
rcx=000001fad58e89c0
.137  Id: 1bac.1b54 Suspend: 1 Teb: 000000aa`cb906000 Unfrozen
      Start: sqldk!SchedulerManager::ThreadEntryPoint (00007ffc`1eda7c10)
      Priority: 0  Priority class: 32  Affinity: 1f
rcx=000001fad58e89c0
.  6  Id: 1bac.1ff4 Suspend: 1 Teb: 000000aa`cb8f2000 Unfrozen
      Start: sqldk!SchedulerManager::ThreadEntryPoint (00007ffc`1eda7c10)
      Priority: 0  Priority class: 32  Affinity: 3e0
rcx=000001fad58e93b0
.137  Id: 1bac.1b54 Suspend: 1 Teb: 000000aa`cb906000 Unfrozen
      Start: sqldk!SchedulerManager::ThreadEntryPoint (00007ffc`1eda7c10)
      Priority: 0  Priority class: 32  Affinity: 1f
rcx=000001fad58e93b0
.  6  Id: 1bac.1ff4 Suspend: 1 Teb: 000000aa`cb8f2000 Unfrozen
      Start: sqldk!SchedulerManager::ThreadEntryPoint (00007ffc`1eda7c10)
      Priority: 0  Priority class: 32  Affinity: 3e0
rcx=000001fad58e89c0
.137  Id: 1bac.1b54 Suspend: 1 Teb: 000000aa`cb906000 Unfrozen
      Start: sqldk!SchedulerManager::ThreadEntryPoint (00007ffc`1eda7c10)
      Priority: 0  Priority class: 32  Affinity: 1f
...
The pattern above is repeated over and over again, because the function gets called several times during each loop iteration.
Furthermore, there were two threads working in parallel: 6 and 137. Curiously, both of them were trying to increment the same memory locations: 000001fad58e93b0 and 000001fad58e89c0.
These target locations are in the database cache, more precisely in its region annotated as MEMOBJ_EXECUTE.
SELECT memory_object_address
     , pages_in_bytes
     , bytes_used
     , type
   FROM sys.dm_os_memory_objects order
   by memory_object_address

memory_object_address	pages_in_bytes	bytes_used	type
0x000001FAD5880060	32768	NULL	MEMOBJ_EXECUTE
0x000001FAD58EC060	16384	NULL	MEMOBJ_COMPILE_ADHOC
Since multiple threads are incrementing the same location, they must utilize the atomic instructions of processors to atomically update a memory location. That involves specifying a lock prefix, which will assert a lock on the cache and sometimes even on the bus. Consequently, its frequent usage will impair performance.
This locking mechanism is nothing unusual within a database and it’s normally used to serialize changes to a shared resource. In fact, that’s exactly how latches are implemented [Lewis 2011]: “Essentially a latch is the combination of a memory location in the SGA and an atomic CPU operation that can be used to check and change the value of that location.”
When executing a stored procedure, for example, a latch might be used to count the number of sessions executing the procedure, to prevent other sessions from altering it. When the execution finishes, the session counts itself off. Once the value is decremented to zero, it means that nobody’s executing the procedure anymore, so, another session can now acquire the latch and proceed with a DDL.
Generally speaking, acquiring a latch is a rather normal event, but what’s completely strange in this case is the huge number of these operations for a single stored procedure call. It almost looks like the individual lines are protected by the latch instead of the whole procedure.
That’s quite a serious disadvantage and, as it turns out, the main reason for the TSQL inefficiency.
Let’s see now if this excessive serialization code path can be somehow avoided.
Natively compiled stored procedures
There’s a possibility to compile TSQL and store it in a DLL. This feature is referred to as natively compiled stored procedure
This indeed boosts the throughput. In fact, the efficiency has approached the C implementation.
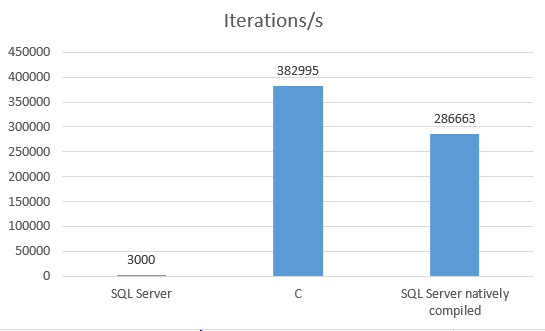
Also, the scalability has approved with the native compilation.
However, natively compiled procedures impose some quite serious limitations. For instance, they only work with memory-optimized tables – neither conventional nor temporary tables are supported. Neither can they reference conventional stored procedures.
As a consequence, you can’t just compile the procedure and, by doing so, make it run X times faster.
Summary
In summary, there is a serious performance and scalability issue with SQL Server TSQL, which is caused by excessive serialization of shared memory access. Not only does Oracle PL/SQL perform an order of magnitude better, but also it scales perfectly. While natively compiled procedures perform really good in SQL Server, they also come with some serious limitations, which, in my opinion, render them unusable for most conventional use cases.
Appendix
The scripts for creating stored procedures used in this blog post are in my Github repository.
You can use Invoke-Load.ps1 for starting them concurrently.
References
- [Chynoweth 2012] Michael Chynoweth (Intel). (2012, March 7). Implementing Scalable Atomic Locks for Multi-Core Intel® EM64T and IA32 Architectures
- [Lewis 2011] Jonathan Lewis. (2011). Oracle Core: Essential Internals for DBAs and Developers
Can you include Oracle PL / SQL natively compiled procedures in the comparison? I’m curious to see how they compare to C and MS SQL native compiled.
Here’s some example code to recompile as native:
ALTER PROCEDURE my_proc COMPILE PLSQL_CODE_TYPE=NATIVE REUSE SETTINGS;
Natively compiled PLSQL is just around 20% faster than interpreted PL/SQL in this case. Originally, I had wanted to include this in the comparison, but then I realized that natively compiled procedures are so different in both database products – with regard to their limitations – that it would be like comparing apples to oranges.
Hey Nenad,
can you please give a few more details about the workload you tested? Simply saying that A is slower than B is a bit meager without more details. I am interested in the meta data of the test table(s) and the context of the stored procs.
Thank you
The workload is a loop executed in a stored procedure. No data and tables are involved, just the procedural logic was tested. The links to the scripts are provided in the Appendix.