CPUs
Currently, there are two CPU types on Microsoft Azure cloud to choose from:
- Gen4: Intel E5-2673 v3 (Haswell) 2,4 GHz, 1 virtual core = 1 physical core,
- Gen5: Intel E5-2673 v4 (Broadwell) 2,3 GHz, 1 virtual core = 1 hyper-thread.
“Gen4” and “Gen5” are just the MS Azure labels for two distinct CPU types. Notice a difference of what you’ll get when buying a virtual core with both configurations: with Gen4 you’ll obtain a physical core, while with Gen5 you’ll get a hyper-thread.
I compared both options with my on-premise installation, which is based on Intel Xeon Platinum 8158 CPU 3GHz.
Test
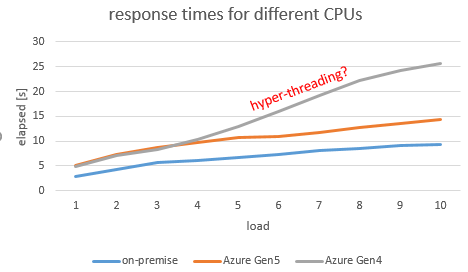
I did that by measuring the elapsed time of a simple loop with 10 million iterations while executing 1000 tests, always with a different number of concurrent sessions ranging from 1 to 10. The databases/instances had 10 virtual CPUs configured. First, I calculated the average elapsed time for every test. At the end, I calculated the average of the averages per load.
The results are below.
Elapsed time [s]
| Load | on-premise | Azure Gen5 | Azure Gen4 |
|---|---|---|---|
| 1 | 2.9417 | 5.0961 | 4.8959 |
| 2 | 4.3199 | 7.3412 | 7.1828 |
| 3 | 5.6204 | 8.7333 | 8.387 |
| 4 | 6.0834 | 9.6425 | 10.3421 |
| 5 | 6.6542 | 10.7658 | 12.9003 |
| 6 | 7.3422 | 10.9933 | 16.0029 |
| 7 | 8.0436 | 11.783 | 19.1483 |
| 8 | 8.5464 | 12.8537 | 22.1933 |
| 9 | 9.1698 | 13.6419 | 24.2563 |
| 10 | 9.4216 | 14.3794 | 25.6255 |
Conclusions
We can draw the following conclusions by looking at the graph and the table above.
Single-thread performance
Gen4 performs just slightly better than Gen5, but only until the load exceeds 50%. At the same time, unsurprisingly, my on-premise installation with Xeon Platinum 8158 CPU 3GHz beats them both by more than 70%.
When looking at the price, at first sight this might seem as a completely unfair race, because a Xeon Platinum 8158 CPU 3GHz core is more than 4 times more expensive than, for example, a Gen5 E5-2673 v4 (Broadwell) core. Or more precisely, the price difference is 434 USD per core. But this one-off premium is entirely negligible compared to the price of the SQL Server licenses. The Enterprise Edition license e.g., amounts to $14256 per core yearly and thus far outweighs the CPU extra cost.
Simply put, it’s a huge waste of money to use expensive licenses for slow CPU cores.
That being said, I can’t see any reason for not picking the fastest processor when building a box for hosting SQL Server as long as its price is significantly lower than the licensing cost. Consequently, it’s a pity that Azure doesn’t offer any faster CPUs. That might specially hurt their customers with CPU-bound non-parallelized workloads.
Hyper-threading?
Further, it struck me that Gen4 starts performing massively worse after the load exceeds 50%. For instance, the average response time on Gen4 is by 80% longer than on Gen5 with 10 concurrent sessions. This performance deterioration might be due to hyper-threading – I’m just speculating. In any case, the consequence is that you have to configure (and, of course, pay!) twice as much virtual CPU cores than you actually need in order to prevent the response times going through the roof.
Fortunately, Gen5 doesn’t seem to be affected by this problem. However, I recommend testing whenever switching to some new core configuration in the future. In the appendix, I described how I did that.
Appendix
Both tests and average calculations are automated. The tests are running for several hours, but the setup takes no longer than 10 minutes:
1. Download the scripts from my GitHub repository.
2. Create the stored procedure sp_cpu_loop by running create_sp_cpu_loop.sql.
3. Configure the connect string in Config.psd1
4. Start the tests:
.\Invoke-Random-Load.ps1 -Iterations 1000 -MaxConcurrency 10 *> tests.logThe command above executes 1,000 tests each of which having between 1 and 10 parallel sessions.
5. Calculate the averages:
.\Show-Statistics.ps1 -File tests.log -Metric AverageThe sample output looks as follows:
Load AVG Average MAX Average Run id 1
---- ----------- ----------- --------
  10     25625.5     30379.7      828
   9     24256.3     27420.5      226
   8     22193.3     24295.5      571
   7     19148.3     20774.3       74
   6     16002.9     17566.1      376
   5     12900.3     14143.5      293
   4     10342.1     11083.7      495
   3        8387     10416.9      238
   2      7182.8      9507.9      731
   1      4895.9        5182      396
Legend:
- Load: the number of concurrent sessions
- AVG Average: average elapsed time calculated for every load in ms
- The other columns are irrelevant for this test.
References
- Microsoft Corp. vCore service tiers, Azure Hybrid Benefit, and migration
- Microsoft Corp. SQL Server pricing
- Intel Corp. Intel® Xeon® Platinum 8158 Processor
- Intel Corp. Intel® Xeon® Processor E5-2697 v4