SOS_SCHEDULER_YIELD wait event measures the time the threads are spending on SQL Server OS (SOS) scheduler queue. Therefore, it will inherently start increasing on an oversubscribed system.
Paul Randal warns us that on a virtualized platform you also have to consider the CPU utilization on the whole physical server. Expectedly, the threads will be queued on an oversubscribed physical server causing SOS_SCHEDULER_YIELD waits, even in the case of low CPU utilization by the VM.
But I’ve been occasionally seeing high SOS_SCHEDULER_YIELD signal wait time even when both VM and the physical server were underutilized.
This prompted me to do a series of tests on SQL Server 2017 to learn when exactly this happens. In doing so, I measured SOS_SCHEDULER_YIELD wait time, CPU time per scheduler and elapsed time. This benchmark and the statistical analysis are fully automated and can be downloaded from my GitHub repository.
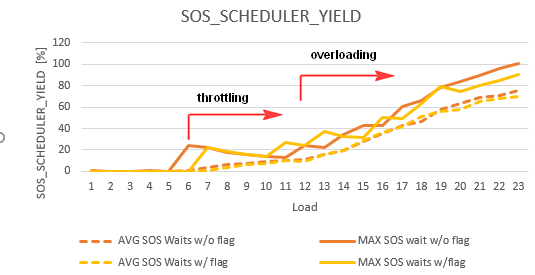
What I found out is that SQL Server will start throttling after the load exceeds 50%. I mean it will put the thread in the queue, instead of using available CPUs. That’s the reason why we’re sometimes seeing SOS_SCHEDULER_YIELD waits even when there’s enough spare CPU capacity.
By the way, I also performed similar load tests with a C program and it scaled perfectly. I did this just to prevent the speculations about common suspects, such as physical host, OS, virtualization layer, hyperthreading, etc.
The following table quantifies the effects of the scheduler throttling (the server has 12 CPU cores):
Load AVG SOS waits(%) MAX SOS waits(%) Run id 1
---- ---------------- ---------------- --------
  23             75.1            101.2     1554
  22             71.3               96      235
  21             68.6             89.5     1263
  20             63.4             84.3     1326
  19             58.1             78.2      465
  18             46.9             65.8     1868
  17             43.2             60.2     2126
  16             35.5             42.6      398
  15             28.2             42.8       91
  14             19.6             34.3      778
  13             15.4             22.5     1665
  12             10.8             24.2     1617
  11              9.7             12.7     1435
  10              9.3             13.9      136
   9              7.4             15.9      329
   8              5.9             17.9     1560
   7              3.9             21.9     1361
   6              0.3             24.3     1432
   5              0.1              0.1      887
   4              0.1              0.5     2181
   3              0.1              0.1     1808
   2              0.1              0.2     1711
The meaning of the columns are:
- Load – the number concurrent of sessions concurrently executing the load.
- AVG SOS waits(%) – average SOS_SCHEDULER_YIELD waits overhead per load
- MAX SOS waits(%) – maximum SOS_SCHEDULER_YIELD waits overhead per load
- Run Id – run id of the test with the highest SOS_SCHEDULER_YIELD overhead for a given load
As you can see, SQL Server already started throttling when it had to serve 7 concurrent sessions. But there were also some outliers with 6 concurrent sessions, like the test having the run id 1432.
Let’s zoom into it:
===============================
Run:  1432
Threads:  6
Elapsed times:
9245.1896
6905.6312
6819.9694
6463.959
9178.9062
6591.4602


Count    : 6
Average  : 7534.18593333333
Sum      : 45205.1156
Maximum  : 9245.1896
Minimum  : 6463.959
Property :


wait_type           wait_time_ms signal_wait_time_ms
---------           ------------ -------------------
SOS_SCHEDULER_YIELD         8840                8837


scheduler_id total_cpu_usage_ms
------------ ------------------
           0               6822
           1               6375
           2                  2
           3                  0
           4               6512
           5                  1
           6                  0
           7                  0
           8               9394
           9               6726
          10                  0
          11                  1
In the excerpt above, we can clearly see that only 5 schedulers were busy, even though we had 6 active sessions. This means that in average one session had to wait inspite having enough CPU capacity in both the VM and the physical server. However, not all of the sessions were equally penalized – two slowest sessions took around 40% longer to complete than the fastest one. In other words, you can experience highly volatile response times even with lower CPU usage without any obvious reason.
This variability in relation to the mean can be measured with the coefficient of variation (CV), which is defined as the ratio of the standard deviation to the mean and often expressed as a percentage. Higher the CV, more volatile the execution times.
The table below shows how the CV increases with the load:
Load AVG CV AVG SOS waits(%) MAX CV Run id 1 MAX SOS waits(%) Run id 2
---- ------ ---------------- ------ -------- ---------------- --------
  23   19.7             75.1   32.6     2246            101.2     1554
  22     21             71.3   33.8     2209               96      235
  21   20.3             68.6   41.4     1198             89.5     1263
  20   20.7             63.4   30.8     1183             84.3     1326
  19   20.2             58.1   33.5     2372             78.2      465
  18   19.9             46.9   29.1      812             65.8     1868
  17     20             43.2   30.3     1262             60.2     2126
  16   19.4             35.5   37.9      402             42.6      398
  15     18             28.2   23.4     1671             42.8       91
  14   14.7             19.6   22.1     2314             34.3      778
  13   12.2             15.4   25.5     1158             22.5     1665
  12   10.1             10.8   18.4     2382             24.2     1617
  11    9.5              9.7   14.9      397             12.7     1435
  10    8.8              9.3   14.1      136             13.9      136
   9      8              7.4   15.5      329             15.9      329
   8    7.4              5.9   16.7     1787             17.9     1560
   7    6.6              3.9   21.1     1361             21.9     1361
   6      5              0.3   15.9     1432             24.3     1432
   5    4.1              0.1   10.4     1788              0.1      887
   4    3.9              0.1   12.9      543              0.5     2181
   3    3.2              0.1   16.8     2015              0.1     1808
   2    0.4              0.1    1.7      317              0.2     1711
   1      0              0.1      0     2398              0.4     1853
Notice that we often have a relatively high variability even with insignificant SOS_SCHEDULER_YIELD wait time, which means that these waits aren’t the only contributor to the volatile response times.
This unbalanced scheduling seems to be a known problem. For instance, Chris Adkin suggests combatting it with the trace flag 8008, which is an undocumented flag that forces assigning the thread to the scheduler with the least load.
So, I repeated the tests with the 8008 flag set and obtained, unfortunately, not so spectacular results:
Load AVG CV AVG SOS waits(%) MAX CV Run id 1 MAX SOS waits(%) Run id 2
---- ------ ---------------- ------ -------- ---------------- --------
  22   17.7             68.3   38.8      592             85.3     1589
  23   15.7             69.9   33.1     1639             90.9     1578
  21   18.2             65.1   31.3      462               80     1803
  20   19.5             57.9   31.5      546             74.5      305
  19   19.4             56.2   29.8      227             78.9     1542
  18   19.6             50.8   22.7      635             63.4      566
  17   19.9             42.1   30.6     1515               49      957
  16   19.3             36.6     29     1047             50.7     1499
  15   18.5             28.4     26        1             31.2      200
  14   14.3             19.4   19.6     1184             32.9     1184
  13   12.4             15.5   20.1     1959             36.8     1959
  12    8.7              9.5   16.4     2325             24.5     2325
  11      9              9.7   17.2     1532             27.1     1532
  10    7.4              7.6     13      204             13.8      204
   9    6.8                6   14.9     1901             15.8     1901
   8    6.1                4   18.1      847             18.6      847
   7    4.9              1.1   20.5     1332             22.2     1332
   6    4.8              0.1   10.8     2373              0.1       20
   5    4.1              0.1     11     1504              0.1      676
   4    4.1              0.1   12.6     2122              0.1     1396
   3    3.4              0.1   17.9     1816              0.1     2014
   2    0.5              0.1    1.8      263              0.1      593
   1      0                0      0     2320              0.1     1565
The systemic throttling started with a somewhat higher load – 8 instead of 7, but alas, the magnitude of the problem remained the same:
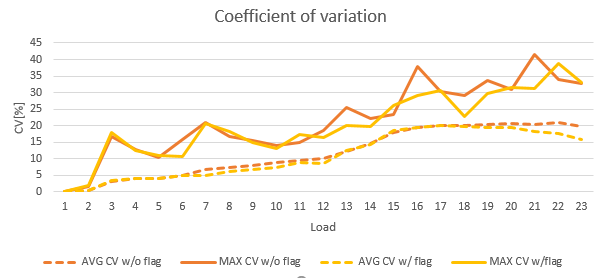
In conclusion, throttling can occure even though there’s enough CPU capacity to handle the workload. The tracing flag 8008 linders the problem a little bit, but it doesn’t resolve it. The CPU overprovisioning can postpone the throttling and therefore can serve as a workaround.